How To Build Your First On-Chain Prediction Model in Python
If you want alpha in this market, stop reading candlestick charts. Start reading the flow.
The smartest capital in crypto isn't drawing trendlines on TradingView. They're training models on decentralized exchange volume, whale inflows, and liquidity removals and front-running volatility before price catches up.
This piece shows you how to build your own on-chain volatility predictor using Python, open data, and a simple random forest model. No hedge fund access. No data vendor license. Just a laptop, some libraries, and a will to decode the truth that lives inside Ethereum.
What You're Actually Building
A model that does this:
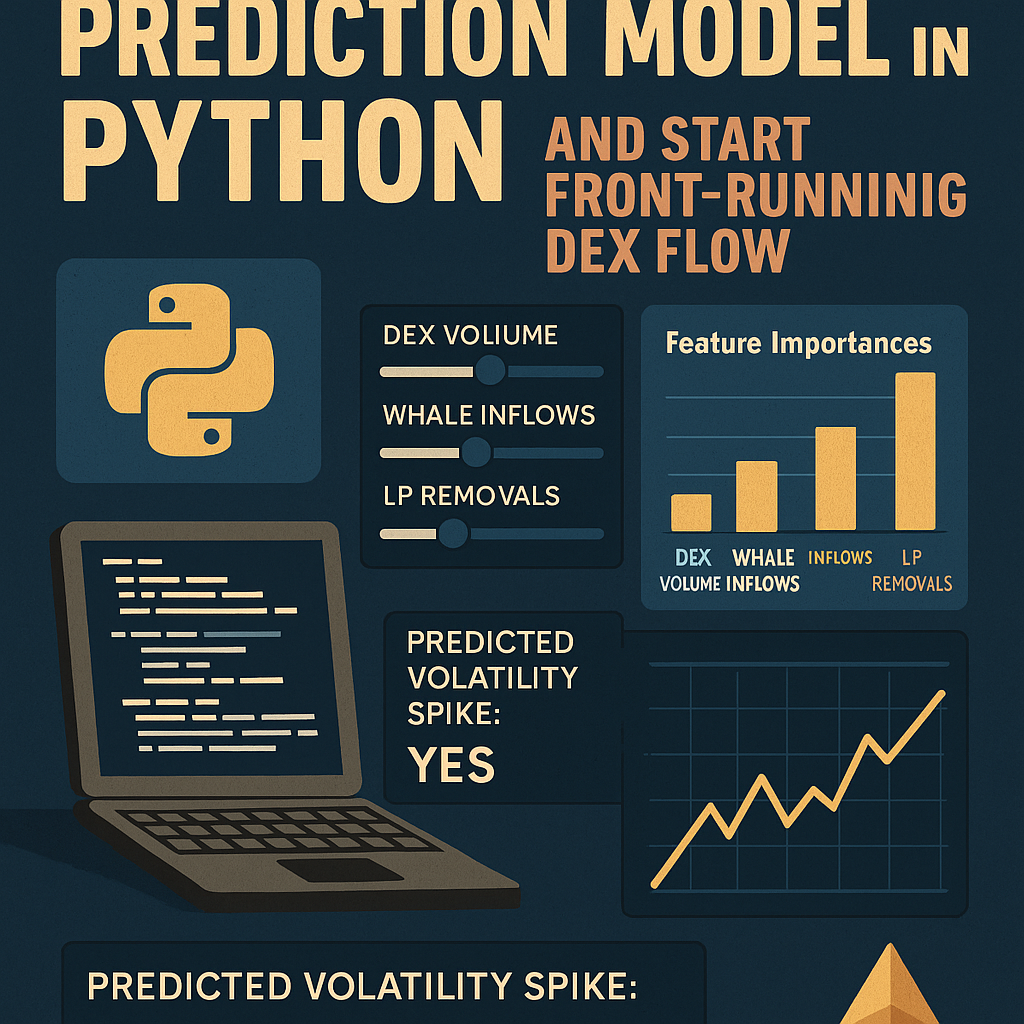
- Pulls hourly DEX volume, whale wallet activity, and LP exits
- Flags when the market is likely to spike in volatility in the next hour
- Tells you when to hedge, when to de-risk, or when to size up
Think of it as an early warning radar, powered not by price, but by real capital movement.
And yes, it works.
Why On-Chain ML Is the Best Risk Radar in Crypto
Let’s review what makes crypto different from TradFi: you can see everything.
- Every swap on Uniswap is public
- Every LP add/remove is timestamped
- Every whale moving ETH to Binance is visible in seconds
- Mempool data tells you what’s about to happen before it settles
Now take that data and feed it into a machine learning model. Let it find the patterns no human can see. You’re not trying to predict “up or down.” You’re predicting chaos. Spikes in volatility. Surges in aggression. Early signs of stress or euphoria.
That’s what traders care about. Not the price but the pressure building underneath it.
Let’s Build It
Tools You’ll Need
- Python (3.8+)
- Pandas, NumPy, Scikit-learn
- Matplotlib
- Optional: Streamlit (for frontend dashboard)
This model uses simulated DEX flow, but you can swap in real data via The Graph, Dune, or Web3.py.
Features You Feed the Model
| Feature | Description |
|---|---|
| dex_volume | Hourly trading volume from DEXs (ETH/USDC for example) |
| whale_inflows | Count of whale wallets sending ETH to exchanges |
| lp_removals | Number of liquidity providers pulling out of pools |
Label: Did volatility spike in the next hour?
1 = yes, 0 = no (based on volume change, or high/low spread)
You train a Random Forest model to learn patterns that historically precede spikes.
What the Model Learns
- When DEX volume surges but LPs exit at the same time, volatility often follows
- Whale inflows to exchanges have predictive power for short-term dumps
- Coordinated LP removals can front-run protocol announcements or depegs
The model turns all of this into a probability. High score = spike likely. Low score = steady chop.
You’re not betting on price. You’re betting on stress levels.
Streamlit Dashboard: Real-Time Insights Without the Bloat
Want a clean UI for your volatility model? Run it on Streamlit which is a Python-based app framework that turns scripts into real-time dashboards in minutes.
Here’s how to turn your on-chain model into a live signal panel with inputs, predictions, and charts: no JavaScript, no front-end headaches.
Step 1: Install Streamlit
pip install streamlit
Step 2: Create the Script
Create a file called app.py and start with your imports and title:
import streamlit as stimport pandas as pdimport numpy as npfrom sklearn.ensemble import RandomForestClassifierfrom sklearn.model_selection import train_test_splitfrom sklearn.metrics import classification_report, confusion_matriximport matplotlib.pyplot as pltst.title("On-Chain Volatility Spike Predictor")
Step 3: Simulate On-Chain Data (Replace with Real API Later)
This mocks data for DEX volume, whale inflows, and LP removals:
np.random.seed(42)n = 500
df = pd.DataFrame({ 'dex_volume': np.random.gamma(2, 1000, size=n), 'whale_inflows': np.random.poisson(5, size=n), 'lp_removals': np.random.poisson(3, size=n),
})df['volatility_spike'] = (df['dex_volume'] > df['dex_volume'].quantile(0.85)).astype(int)
Step 4: Train the Model
X = df[['dex_volume', 'whale_inflows', 'lp_removals']]y = df['volatility_spike']X_train, X_test, y_train, y_test = train_test_split(X, y, test_size=0.2, random_state=42)model = RandomForestClassifier(n_estimators=100, random_state=42)
model.fit(X_train, y_train)
y_pred = model.predict(X_test)
Step 5: Show Model Performance
st.subheader("Classification Report")
st.text(classification_report(y_test, y_pred))st.subheader("Confusion Matrix")
st.text(confusion_matrix(y_test, y_pred))
Step 6: Visualize Feature Importance
importances = model.feature_importances_
features = X.columns
fig, ax = plt.subplots()ax.bar(features, importances, color='skyblue')ax.set_title("Feature Importances")
st.pyplot(fig)
Step 7: Add Live Input Sliders for Traders
Let users simulate market conditions:
st.subheader("Try Your Own Inputs")dex_volume = st.slider("DEX Volume", min_value=0.0, max_value=10000.0, value=2000.0)whale_inflows = st.slider("Whale Inflows", min_value=0, max_value=20, value=5)lp_removals = st.slider("LP Removals", min_value=0, max_value=10, value=3)
input_data = pd.DataFrame({ 'dex_volume': [dex_volume], 'whale_inflows': [whale_inflows], 'lp_removals': [lp_removals]
})
Step 8: Run Prediction in Real-Time
prediction = model.predict(input_data)[0]st.write("Predicted Volatility Spike:", "Yes" if prediction == 1 else "No")
Deploy in 5 Minutes via Streamlit Cloud
- Push your
app.pyandrequirements.txtto GitHub (here's the full code if you were too lazy to copy the code above: app-code save it as app.py and run it) - Requirements should include:nginxCopyEdit
streamlit
scikit-learn
pandas
numpy
matplotlib - Go to streamlit.io/cloud
- Connect your GitHub
- Select the repo and deploy
Boom. You’ve got a real-time market intelligence app pulling from on-chain-style data, running predictions, and delivering alpha through sliders and stats.
From here, you can plug in real Dune queries or Web3.py to replace the simulation and go live with real wallet flow.
What's Next: From Demo to Deployment
Here’s how to level up the basic model:
| Upgrade | What It Does |
|---|---|
| Real-time data | Feed in Dune queries or The Graph APIs |
| Ensemble models | Combine tree models with logistic regressions |
| Alert system | Send Discord/Telegram alerts for high-probability events |
| Add wallets | Include address-level behavior as features |
| Label differently | Predict realized volatility, not just binary spike |
| Integrate trading | Trigger hedge adjustments in real portfolios |
You’re building a quant signal pipeline. A few hours of work can become an edge you run daily.
Why This Can Give You An Hedge
Most crypto market structure is still naive.
LPs sit passively in pools. Retail chases candles. Protocols offer static fees. Volatility nukes the unprepared.
But on-chain ML changes the game. When you model the flow, not the price, you get ahead of the curve. You see the stress before the wick.
Every edge in this market comes down to one thing: who knows first.
This model gets you closer.
This isn’t a toy. It’s a foundation.
Anyone can build this. Most won’t. The data is public. The tools are free. The alpha is waiting.
Stop watching the chart. Start watching the chain. And let the models show you what’s next!